Artist对象

Artist对象

python科学计算第二版 张若愚

matplotlib的基本图像是这样的,所有的绘图元素都继承自Artist类,在matplotlib画出的图上看到的一个个元素,实际上就是这些对象。

总体上,这些对象可以分为简单类型和容器类型两种,简单的Artist对象是标准的绘图元件,例如plot()方法生成的Line2D对象,add_patch()方法生成的Rectangle对象,text()方法生成的Text对象等等。更高级的方法可能会绘制出更复杂的元素,但本质上都是这些基本对象的组合。

容器类型可包含多个Artist对象,使他们组织成一个整体,例如Axis,Axes,Figure等,这些基本绘图元素都储存在容器对象中,比如绘制的Axes对象都储存在Figure.axes列表中,Axes绘制的Line2D对象都储存在Axes.lines列表中,绘制的Rectangle对象都储存在Axes.patches列表中,而轴axis又是Axes下面的一个子容器Axes.xaxis,轴上又有Axes.xaxis.label标签等元素。

通过这种一层层的嵌套组合,最终构成了一幅绘图。要清楚的就是大家都是对象,同时都继承自Artist基类,所以有一些一致的接口,比如set_*()get_*(),分别设置和获取自己的属性。比如如果想让某个东西看不见,方法都是一样的*.set_visible(False)

有时候很多看似复杂的绘图要素,往下一层层分析,发现他某个特点可能是一个很基本的对象,比如Text,这时候就可以用Text对象的接口去对这个属性进行修改。同时,matplotlib提供了一些更高级的接口,比如可以用Axes.set_xticks, Axes.set_xticklabels, Axes.tick_params()去修改标签的属性,但要知道,这些属性并不是Axes所具有的,而是Axes下子容器所拥有的属性,这里只是语法糖。认识到这一点,对matplotlib的认识就会清晰很多,很多命令就都不需要特意去记忆了。

一个例子

1
2
3
4
5
6
7
8
9
10
11
12
13
14
15
16
17
18
19
20
21
22
23
24
25
26
27
28
29
30
31
32
33
34
35
36
37
38
39
40
41
42
43
44
45
46
47
48
49
50
51
52
53
54
55
56
57
58
59
60
61
62
63
64
65
66
67
68
69
70
71
72
73
74
75
76
77
78
79
80
81
82
83
84
85
86
87
88
89
90
91
92
# create figure
fig = plt.figure(figsize=(6, 6))

# 1. the background color of a figure is indeed determined by the 'color' attribute of its patch attribute. 2. usage of set() method of Artist objects.
fig.patch.set(color="lightsteelblue", alpha=0.1)

# two ways to create an Axes object.
ax = fig.add_subplot(2, 1, 1)
ax2 = fig.add_axes([0.15, 0.1, 0.2, 0.2])
ax3 = fig.add_axes([0.2, 0, 0.1, 0.4])
ax4 = fig.add_axes([0.5, 0, 0.4, 0.3])

# it's similar to a figure.
ax2.set_facecolor("black")
ax3.patch.set_facecolor("yellow")

# hist() method creates 50 Rectangle objects and they are saved in Axes.patches.
n, bins, rects = ax4.hist(np.random.randn(1000), 50, facecolor="royalblue")
rects[20].set_color("red")
ax4.patches[40].set_color("firebrick")

# Axes.add_patch() method can add a patch object to the current Axes, and it's also saved in Axes.patches.
rect = plt.Rectangle(xy=(2.3, -1), width=0.25, height=1, facecolor="orange")
ax.add_patch(rect)

# plot() method creates Line2D objects which are saved in Axes.lines
line_1 = ax.plot([1, 2, 3], [1, 2, 3])
line_2 = ax.plot([1, 2, 3], [-1, -2, -3])

# All classes inherit from the Artist class, so set_*() and get_*() methods can be used to set or get attributes.
line_1[0].set_color("black")
line_2[0].set_color("red")
line_1[0].set_linestyle("--")
line_2[0].set_linestyle("-.")
line_1[0].set(linewidth=2, marker="o", markerfacecolor="None", markeredgecolor="blue")
line_2[0].set(linewidth=2, marker="s", markerfacecolor="None", markeredgecolor="cyan")

# scatter() method creates a PathCollection object which is saved in Axes.collections.
pathcollection = ax.scatter(
[1, 2, 3], [0, 0, 0], facecolor=["black", "blue", "orangered"]
)

# 'handles' is a list of Artist objects, and 'labels' is a list of the corresponding label texts.
legend_1 = ax.legend(handles=[line_1[0]], labels=["jiji!"], loc="lower left")
legend_2 = ax.legend(
handles=[pathcollection],
labels=["miaomiao!"],
loc="upper right",
bbox_to_anchor=(0.8, 0.8),
)

# legend_2 will override legend_1, so you have to use add_artist() method to add legend_1 to ax manually.
ax.add_artist(legend_1)

# set xticks.
ax.set_xticks([1, 1.5, 2, 2.5, 3])

# set xtick labels.
ax.set_xticklabels(["ji!", "miao!", "wang!", "ho!", "niang!"], fontsize=25)

# tick_params() is an interface provided by Axes which can be used to set the attributes of ticklines and ticklabels, the indicated ticklines are major or minor depending on 'which' parameter.
ax.tick_params(axis="x", which="major", length=20, width=1, labelcolor="lawngreen")
ax.tick_params(axis="x", which="minor", length=12, width=1)

# Indeed ticklabels and ticklines are attributes of Axes.xaxis or Axes.yaxis, so Axes.set_xticks, Axes.set_xticklabels, and Axes.tick_params are syntactic sugar on it.
for i, label in enumerate(ax.xaxis.get_ticklabels()):
if (i % 2) == 0:
label.set_color("red")
label.set_rotation(45)
label.set_fontsize(16)

# When there is a top axis in Axes, the returned ticks of ax.xaxis.get_ticklines() alternate between the bottom axis and the top one.
for i, major_tick in enumerate(ax.xaxis.get_ticklines()):
if (i % 2) == 1:
major_tick.set_markersize(30)
major_tick.set_markeredgecolor("cornflowerblue")
major_tick.set_markeredgewidth(3)

for i, minor_tick in enumerate(ax.xaxis.get_ticklines(minor=True)):
if (i % 2) == 0:
minor_tick.set_markersize(5)
minor_tick.set_markeredgecolor("springgreen")
minor_tick.set_markeredgewidth(2)

ax.set_xlabel("x")
ax.set_ylabel("y")
ax.get_xaxis().get_label().set_color("green")

ax.spines["right"].set_visible(False)

plt.savefig("fig_1.png")

一些评论

plt.figure()创建一个Figure对象,fig.add_axes()创建一个Axes对象,参数是一个形如[x0, y0, width, height]的列表,各个值都是Figure对象长度和宽度的相对值。在构成图表的各种Artist对象中,最上层的对象是Figure,它包含组成图表的所有元素。当调用add_subplot()add_axes()方法往图表中添加子图时,这些子图都将添加到Figure对象的axes属性中:

1
print(fig.axes)
1
[<AxesSubplot:xlabel='x', ylabel='y'>, <Axes:>, <Axes:>, <Axes:>]

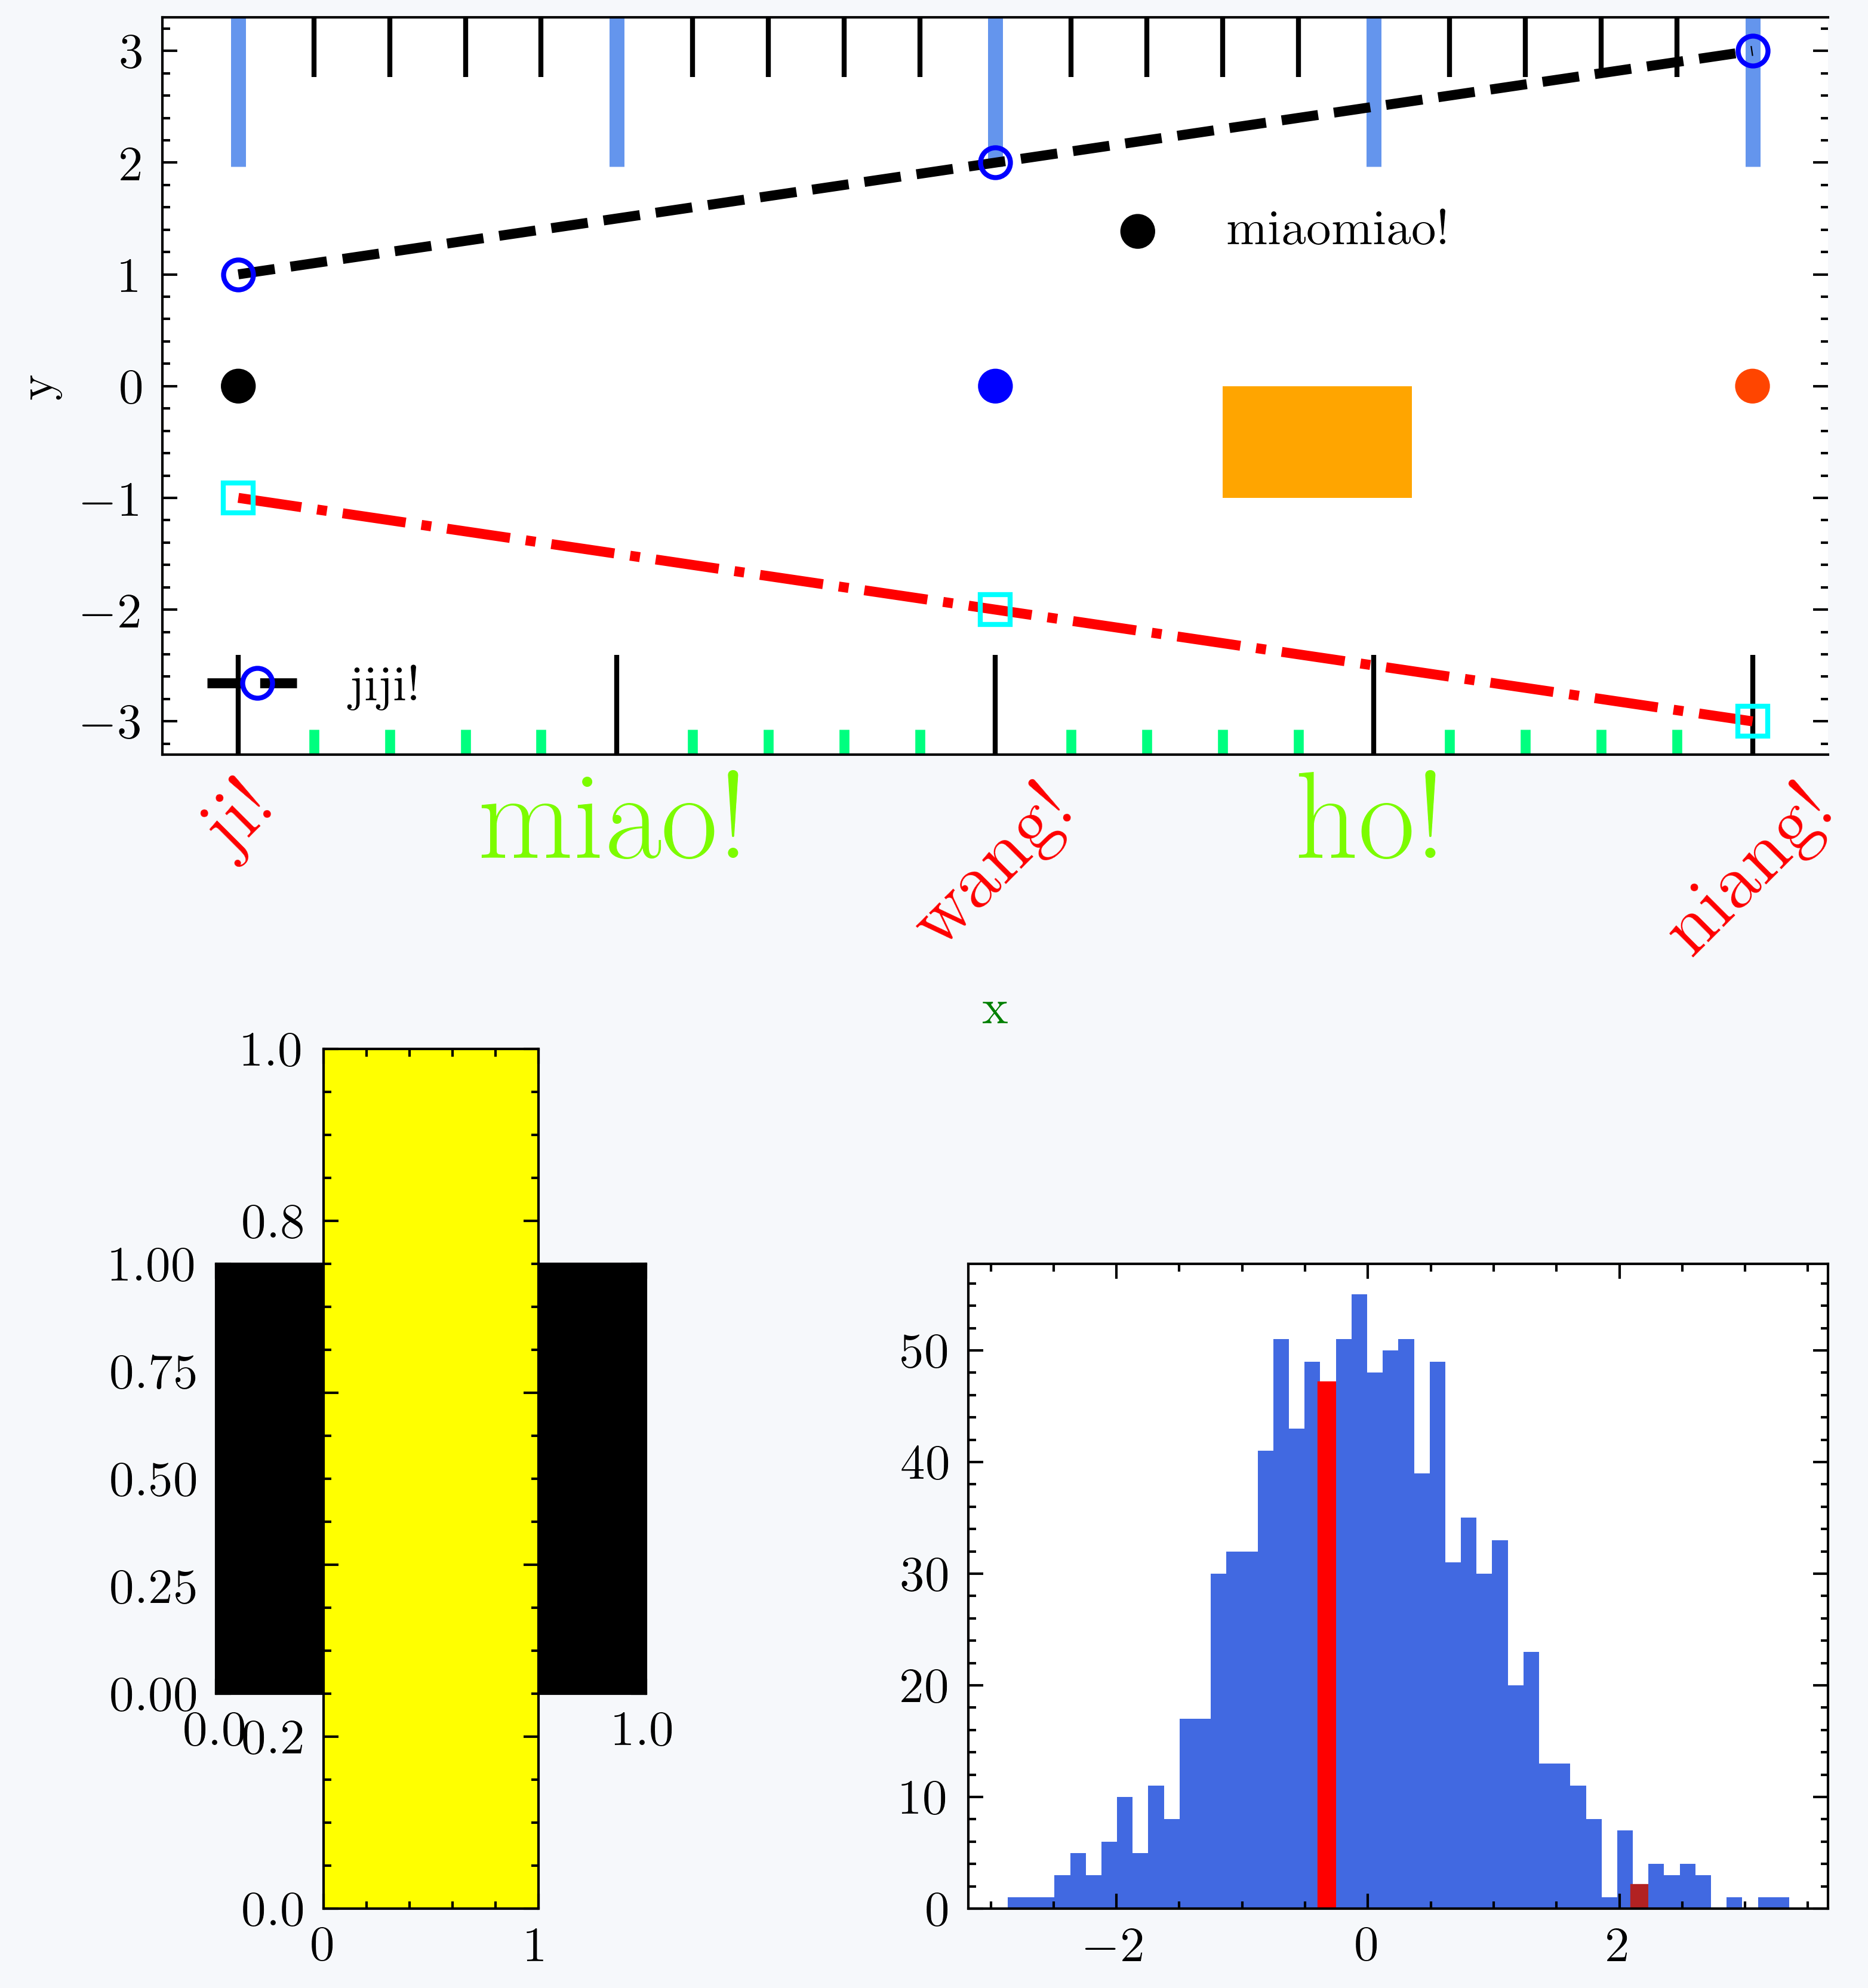
Axes容器是matplotlib的核心,它包含了组成图表的众多Artist对象,并且有许多方法函数帮助创建和修改这些对象。和Figure容器一样,它拥有一个patch属性作为背景,当它是笛卡尔坐标时,patch属性是一个Rectangle对象;当它是极坐标时,patch属性是一个Circle对象。

当然,这里matplotlib提供了一个语法糖,Axes本身也有facecolor属性,对它进行修改就想当于修改patch属性的facecolor属性。

大体上来讲,Axes对象包含两类绘图元素,一类是plot()方法绘制出的Line2D对象,它们都被储存在Axes对象的lines属性列表中;另一类是比如绘制柱状图的bar()函数与直方图的hist()函数,这些函数将创建一个Patch对象的列表,每个元素都是从Patch类派生的Rectangle对象,所创建的对象都被添加进了Axes对象的patches属性中。

ax.plot()绘制曲线,返回表示该曲线的Line2D对象,返回值是只有一个对象的列表(因为可以传递多组X-Y轴的数据给plot(),同时绘制多条曲线)。

ax.lines是一个包含所有曲线的列表,每用ax.plot()绘制一条曲线,所创建的Line2D对象就会添加到该列表中。要删去某个曲线,删去列表中的对应元素即可。

1
2
3
print(line_1[0])
print(line_2[0])
print(ax.lines)
1
2
3
[<matplotlib.lines.Line2D object at 0x7f91f2f8f370>] 
[<matplotlib.lines.Line2D object at 0x7f91f2f8f700>]
[<matplotlib.lines.Line2D object at 0x7f91f2f8f370>, <matplotlib.lines.Line2D object at 0x7f91f2f8f700>]

图例接受两个参数,handles是一个Artist对象的列表,labels是对应的标签列表。

ax.set_xlabel()可以设置x轴的标题,但这实际上是matplotlib提供的语法糖,Axes本身并没有xlabel属性:

1
2
3
print(ax.xaxis)
print(ax.xaxis.label)
print(ax.xaxis.label._text)
1
2
3
XAxis(37.8,18.900000000000002) 
Text(0.5, 12.455676710382942, 'x')
x

Axes对象的xaxis属性是一个XAxis对象,XAxis对象的label属性是一个Text对象,Text对象的_text属性为设置的字符串。由于它们都是从Artist类继承过来的,所以可以像上面这样,设置Text对象的属性:

1
ax.get_xaxis().get_label().set_color("green")

也可以像上面一样,用set()一次设置多个属性。

想要查看某个Artist对象的所有属性名及其对应的值,可以使用

1
plt.getp(ax.xaxis.label)

Axis容器包括坐标轴上的刻度线、刻度文本、坐标网格以及坐标轴标题等内容。刻度包括主刻度和副刻度,分别通过get_major_ticks()get_minor_ticks方法获得。每个刻度线都是一个XTick或YTick对象,它包括实际的刻度线和刻度文本。为了方便访问刻度线和文本,Axis对象提供了get_ticklabels()get_ticklines()方法来直接获得刻度线文本和刻度线,刻度线是一个Line2D对象,刻度线文本是一个Text对象。

当然,这样修改太复杂了,matplotlib提供了Axes的tick_prams()方法,直接对标签和刻度的属性做出修改。