1
2
3
4
5
6
7
8
9
10
11
12
13
14
15
16
17
18
19
20
21
22
23
24
25
26
27
28
29
30
31
32
33
34
35
36
37
38
39
40
41
42
43
44
45
46
47
48
49
50
51
52
53
54
55
56
57
58
59
60
61
62
63
64
| \documentclass{beamer}
\setbeamertemplate{footline}[frame number]
\setbeamertemplate{caption}[numbered]
\usepackage{ctex}
\usepackage{adjustbox}
\usepackage{pgfplots}
\usepackage{caption}
\pgfplotsset{compat=1.17}
\pgfplotsset{
/pgf/number format/textnumber/.style={
fixed,
fixed zerofill,
precision=1,
},
}
\usepackage{tikz}
\usetikzlibrary{positioning, calc,fit}
\newcommand{\drawgrid}[2]{
\draw[very thin, draw=gray, step=0.02] (0,0) grid (#1,#2);
\draw[thin, draw=red, xstep=0.1, ystep=0.1] (0,0) grid (#1,#2);
\foreach \x in {0,0.1,...,#1} {
\node [anchor=north] at (\x,0) {\tiny \pgfmathprintnumber[textnumber]{\x}};
}
\foreach \y in {0,0.1,...,#2} {
\node [anchor=east] at (0,\y) {\tiny \pgfmathprintnumber[textnumber]{\y}};
}
}
\begin{document}
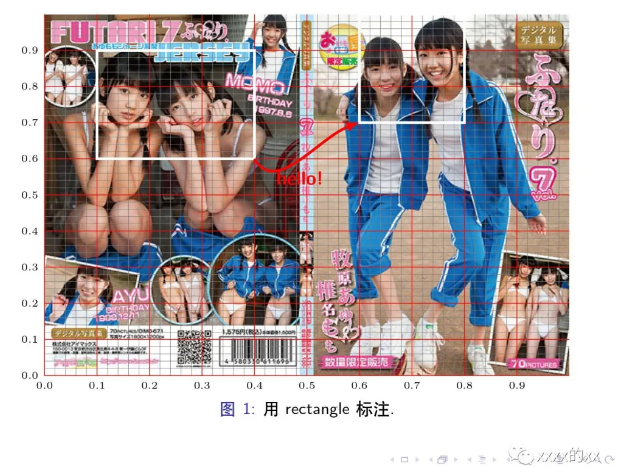
\begin{frame}
\begin{adjustbox}{width=\linewidth}
\begin{tikzpicture}
\node[anchor=south west,inner sep=0] (image) at (0,0) {\includegraphics[width=\linewidth]{ji ji.jpg}};
\node[inner sep=0pt,below=\belowcaptionskip of image,text width=\linewidth]
{\captionof{figure}{用rectangle标注.}\label{fig:fig1}};
\begin{scope}[x={(image.south east)},y={(image.north west)}]
\drawgrid{1}{1}
\draw[white,ultra thick] (0.1,0.6) rectangle (0.4,0.9);
\draw[white,ultra thick] (0.6,0.7) rectangle (0.8,1.0);
\draw[red,ultra thick,-latex] (0.4,0.6) to [out=-60,in=200] node[anchor=north,red,yshift=-2] {\textbf{hello!}} (0.6,0.7);
\end{scope}
\end{tikzpicture}
\end{adjustbox}
\end{frame}
\begin{frame}
\begin{adjustbox}{width=\linewidth}
\begin{tikzpicture}
\node[anchor=south west,inner sep=0] (image) at (0,0) {\includegraphics[width=\linewidth]{ji ji.jpg}};
\node[inner sep=0pt,below=\belowcaptionskip of image,text width=\linewidth]
{\captionof{figure}{用fit标注.}\label{fig:fig2}};
\begin{scope}[x={(image.south east)},y={(image.north west)}]
\drawgrid{1}{1}
\node[fit={(0.1,0.6) (0.4,0.9)}, inner sep=0pt, draw=white, ultra thick] (box1) {};
\node[fit={(0.6,0.7) (0.8,1)}, inner sep=0pt, draw=white, ultra thick] (box2) {};
\draw[red,ultra thick,-latex] (box1.south east) to [out=-60,in=200] node[anchor=north,red,yshift=-2] {\textbf{hello!}} (box2.south west);
\end{scope}
\end{tikzpicture}
\end{adjustbox}
\end{frame}
\end{document}
|

